New reports
Backlog Treemap
The most important job of the product owner is to understand the product backlog at any point in time. The product owner needs to know what to plan as the next, what was delivered and when, what is blocking backlog items, and who.
You will probably need to understand business value vs. risk, or business value vs. effort, or effort estimation in story points compared to time spent.
We found this information very valuable in our 10 years of product ownership, therefore we decided to add it to the ScrumDesk as two reports giving the product owner such perspective from multiple sides.
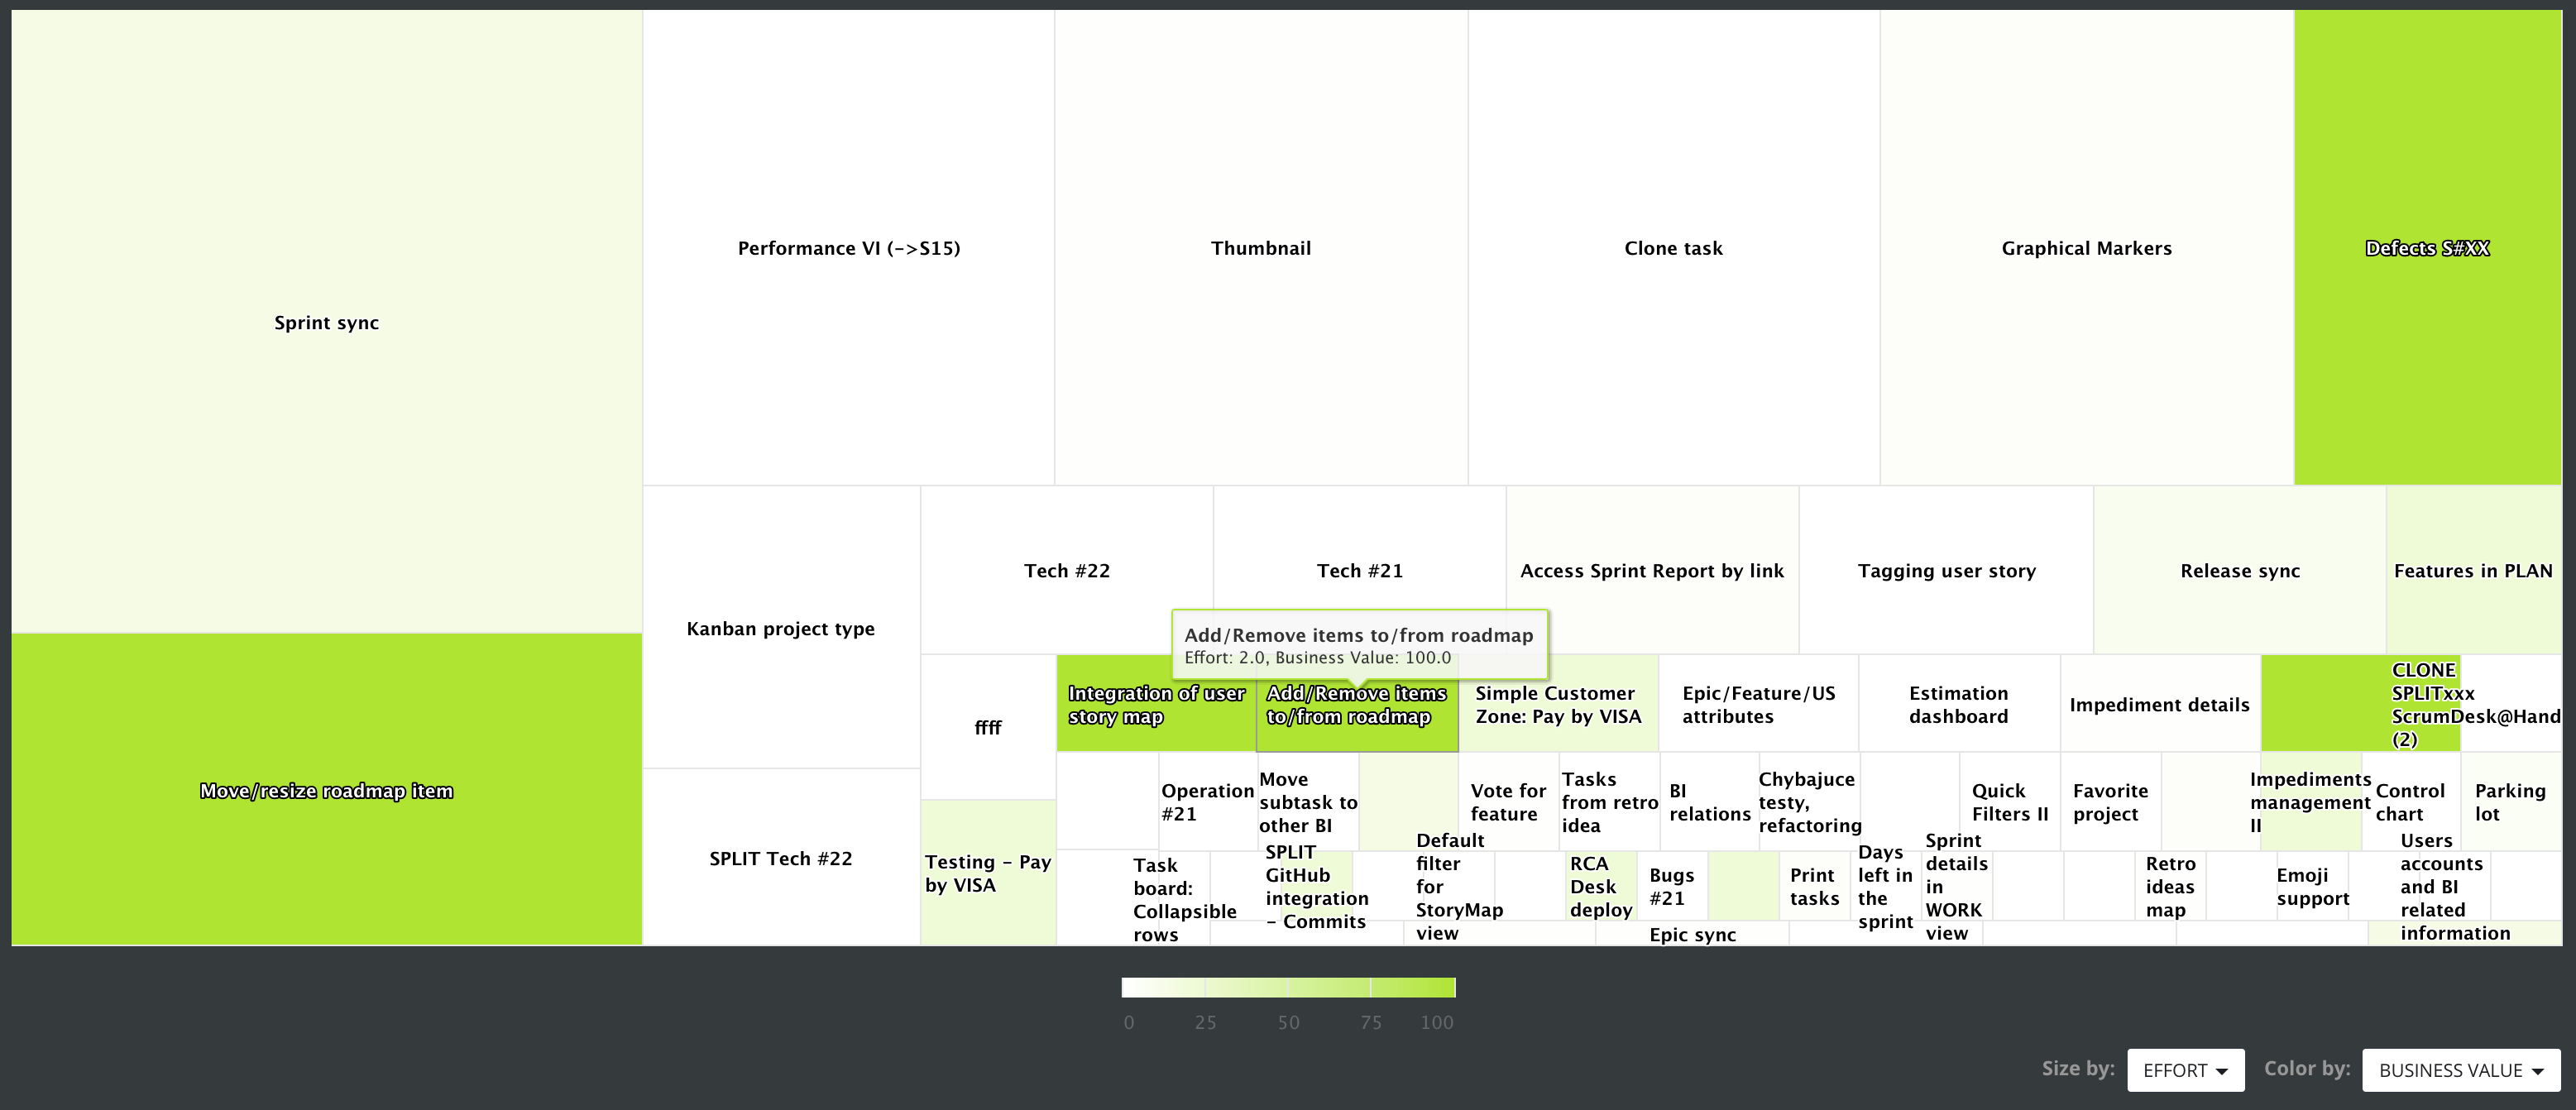
The first one is the Backlog Treemap chart that displays backlog items as rectangles in the treemap. The size of the rectangle can represent a selected attribute of the backlog item while color can represent some other.
I needed to find the most valuable backlog items that can be delivered with small effort. The size represents the effort, color represents the business value as you can see in combo boxes at the bottom of the picture.
The greenest rectangles are the most valuable, so everything that I need to search for is the smallest very green rectangle. And boom, there is such a feature hidden in my backlog, Add/Remove items to/from the roadmap. It is very valuable and effort necessary for its completion is small. I have to think about it for the next sprint, definitely!
More information on what is possible to do with this chart can be found here.
Product Backlog Analysis
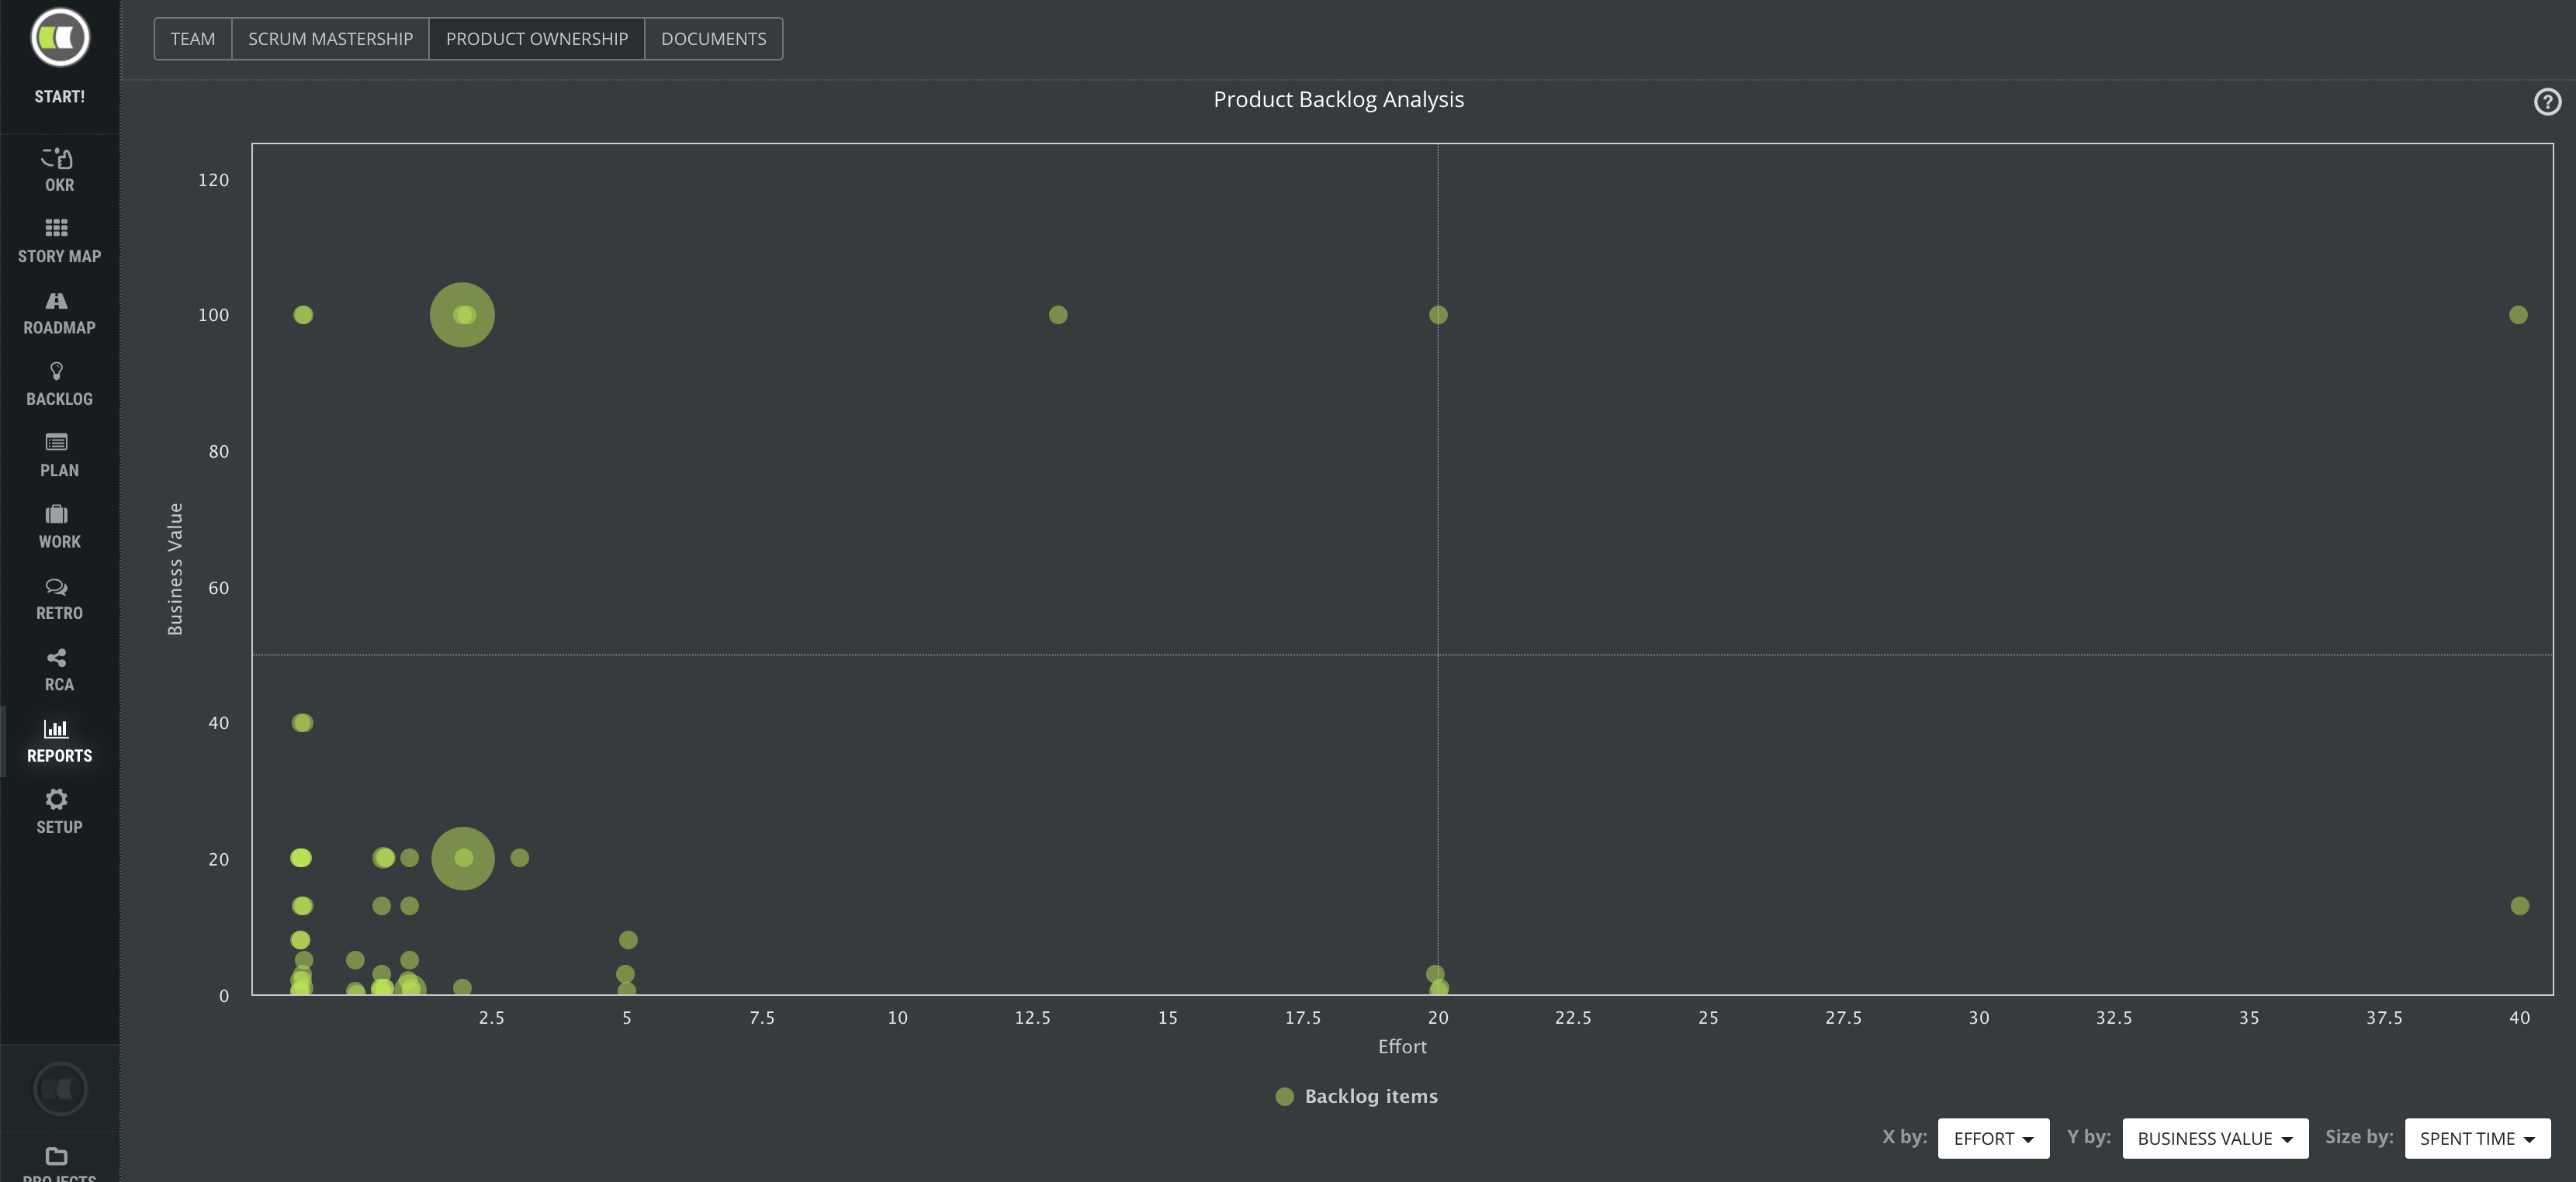
The next chart gives the product owner even more information. The product owner can compare four values in the Product backlog Analysis chart. Every product backlog item is represented as a small dot in color by its status.
I want to understand if we spend an effort on the most valuable items and if we were good in their estimation. The effort in story points is displayed on X-axis. The business value on the Y-axis. From what I can understand that the most of valuable backlog items can be delivered in a relatively small effort.
When I displayed the size of to circle by the time spent, I found that the team’s estimation in story points vs. time was not precise as the biggest circles (the biggest spent time) are assigned to 2 story points which doesn’t make sense.
So now I know what to ask my team!
More information and examples can be found here.
Sprint Report, removed stories
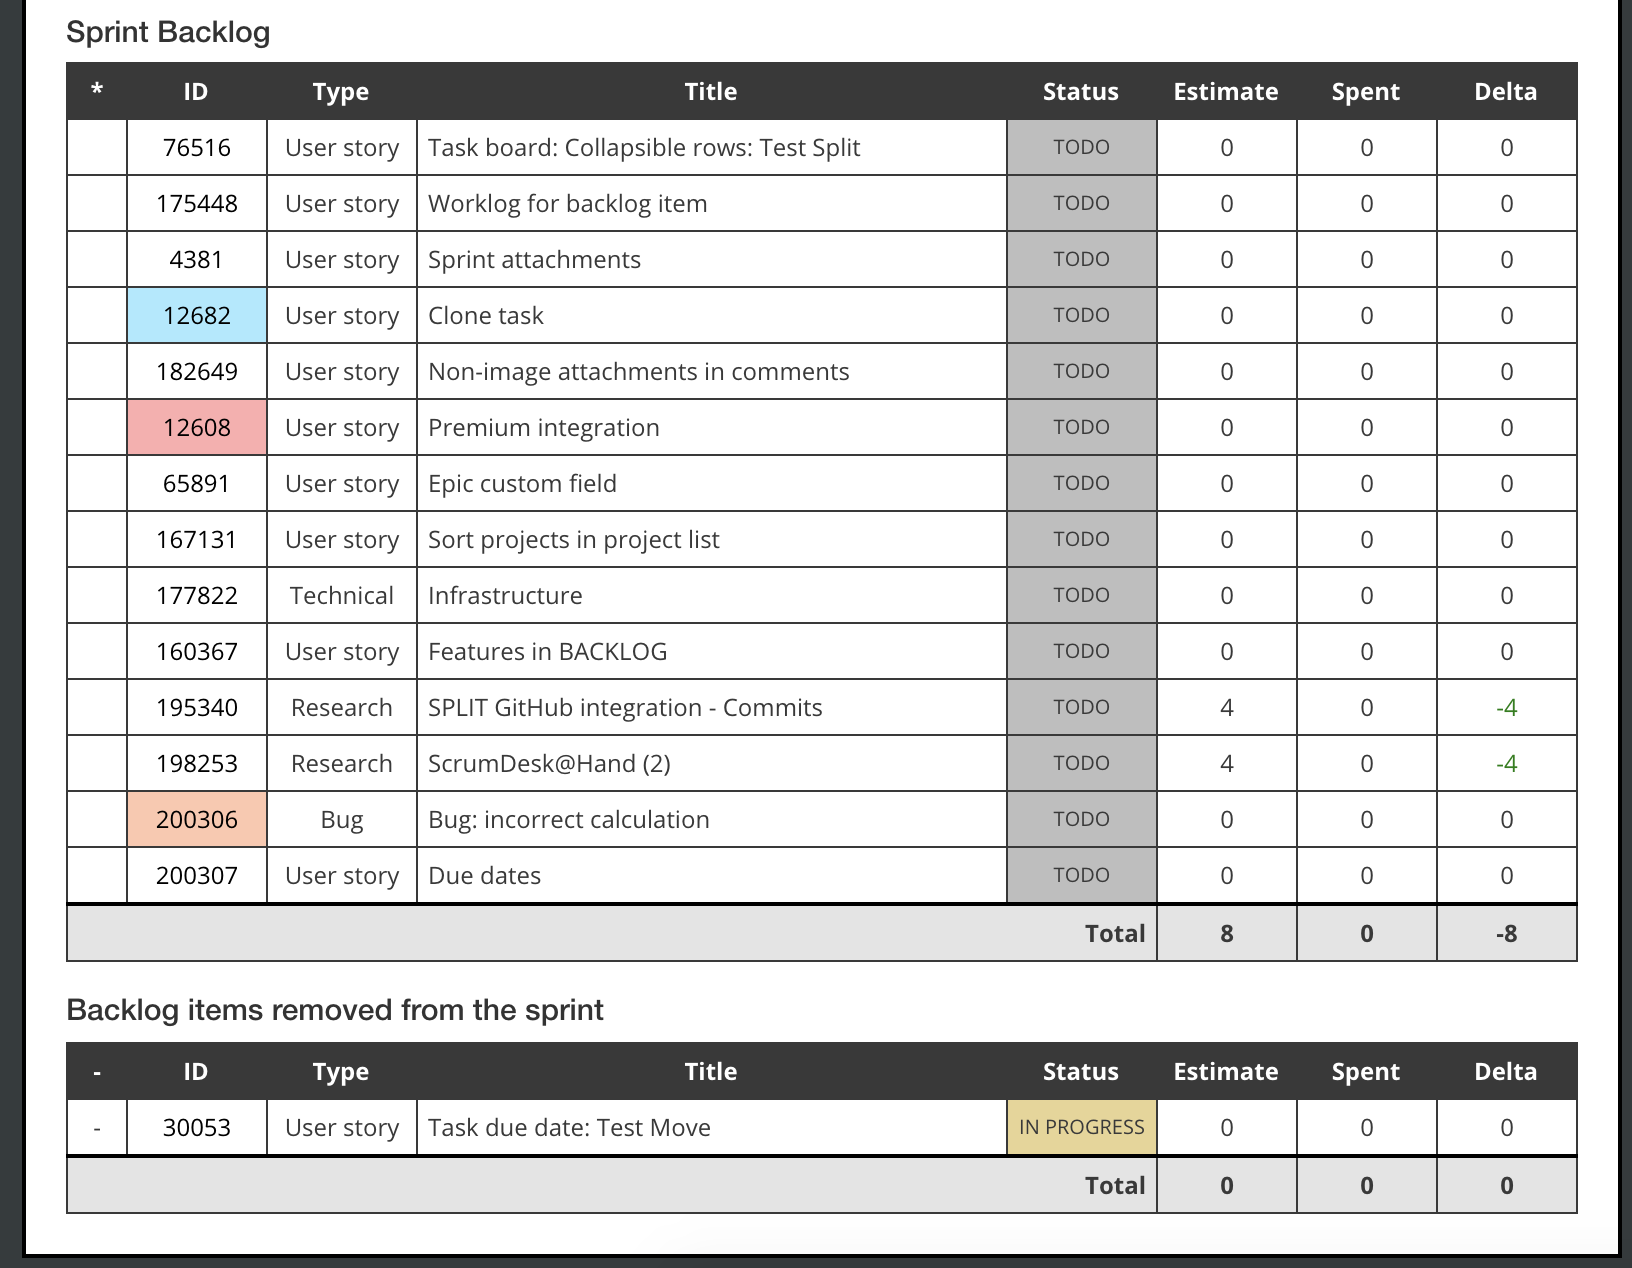
The Sprint Review document provides all information necessary for the agile team and scrum master they need to have for proper sprint review. Stakeholders are able to see the status of backlog items planned for the sprint, time, estimation, and team who worked on them.
Now we added the possibility to see which planned user stories were removed from the sprint or split at the end of the sprint. They are displayed at the end of the Sprint Review document with a brief time-tracking summary.
New charts in Sprint detail view
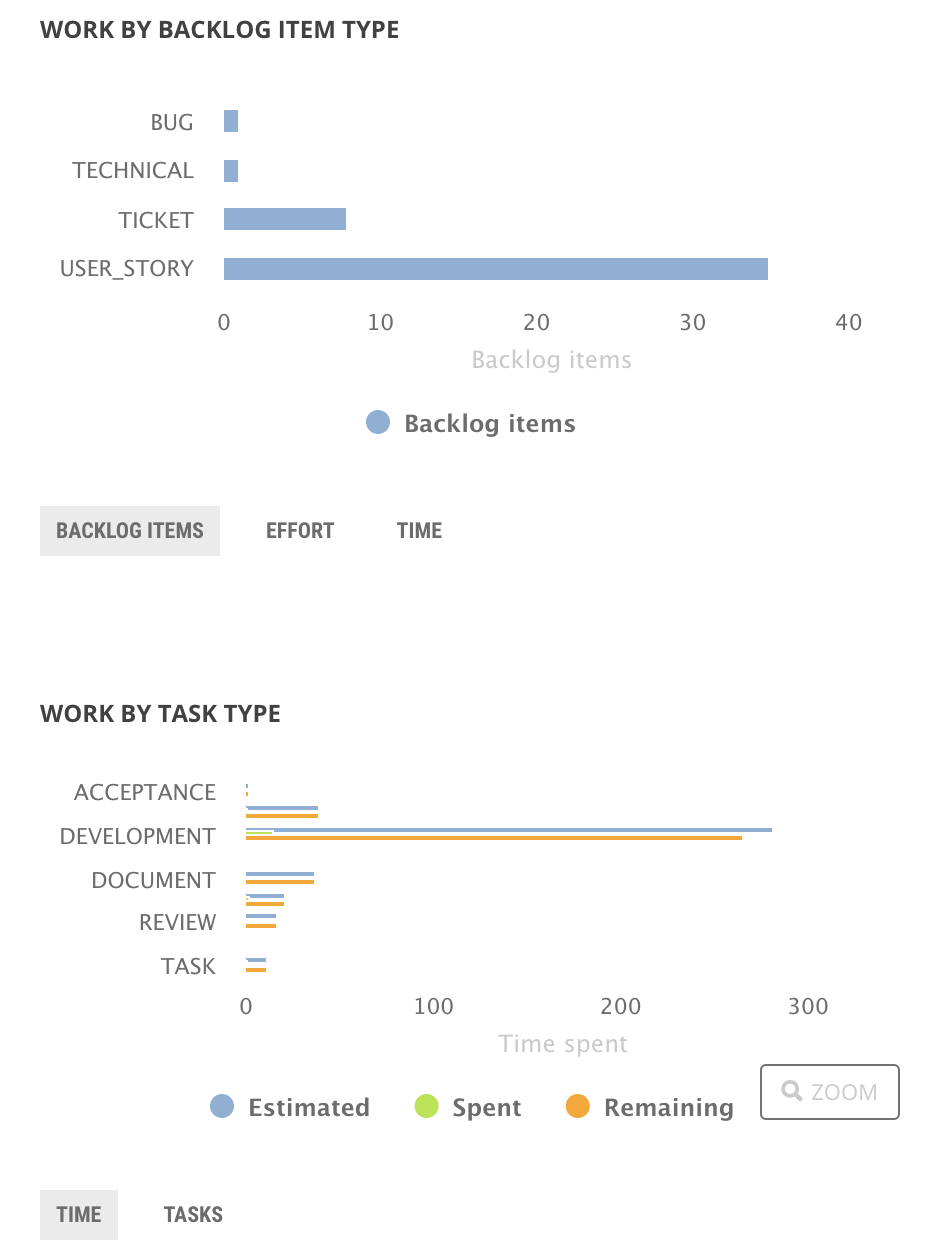
For a better overview of the sprint, we added two new charts reporting the split of work by types of backlog items and by the type of subtasks. ScrumMasters The product owner will see the overall structure of the sprint backlog while ScrumMasters can check the split of work by the type in the agile team.
Thumbnails
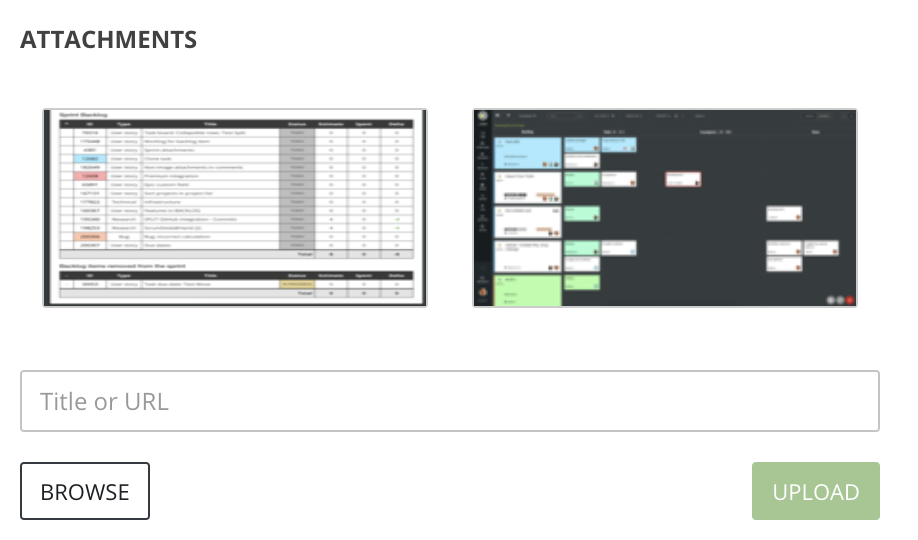
Pictures and attachments are now displayed with thumbnails to give users the possibility to find the proper picture faster. The next version will support an upload of multiple files and a drop of files.
Retrospective cards on Kanban board
The ScrumDesk RetroDesk, the module of ScrumDesk application, allows agile teams to record retrospective ideas and vote for the best. So far the ideas were represented by cards that were possible to freely pin on a virtual board, the desk.
With this version, it is possible to display them on the retrospective kanban board, where every column represents the idea category (+, -, start, stop, etc.)
Cards are sorted in a column by the number of votes they got by the team members.
WORK view
The Work view is the most used functionality of ScrumDesk. Of course, why not if this tool is for the team which spends most of the time working in a sprint with the Kanban board.
Kanban view new L size card
We added an additional L card size to the Kanban layout of WORK view which displays assigned team members and estimated time. The card size can be chosen form by click on L button displayed in the top right corner of the WORK view.
Add a new item to the product backlog directly in WORK view
Working as the Product owner you might have a new backlog item arriving at your desk at any moment. Therefore, to save the time necessary for switch the view to the BACKLOG or STORY MAP view in such case, we included the possibility to add the new item directly to the product backlog even in WORK view by clicking on the first button with this icon ![]() located at the top of the WORK view.
located at the top of the WORK view.
Change the order of backlog items in WORK view
The order of backlog items was possible to set in the PLAN view. This action is done usually by the product owner in the sprint planning, or better prior to it. But change is the reality even in perfect Scrum. Sometimes the product owner will realize it would be better to deliver backlog items in a different order.
Now it is possible to change the order of backlog items by drag and drop of backlog item cards or in the side view displaying the detail of the backlog item.
Change of order of subtasks in the Sideview detail
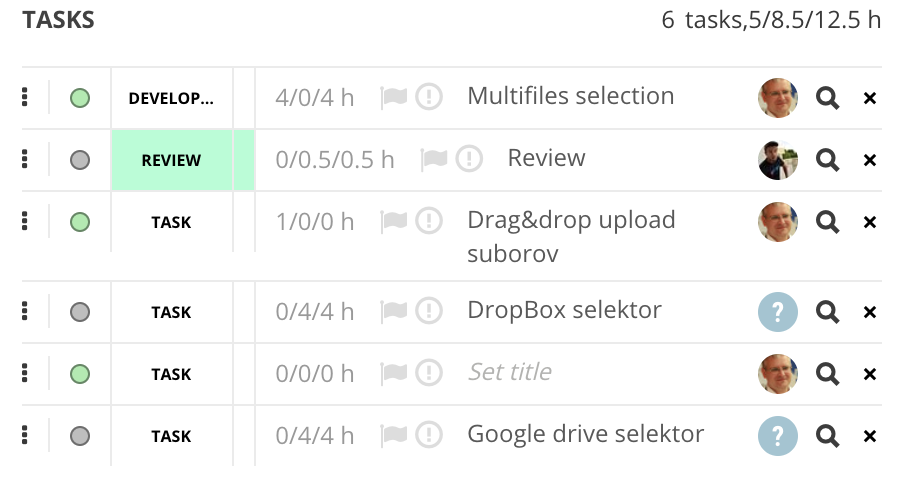
The order of subtasks can be changed in the detail side view by the drag of the handle displayed before every task. The order will be updated on the board as well. And don’t forget that the order can still be changed on the kanban board directly.
Locate task on Kanban board
Sometimes you will receive an email with the link to tasks or backlog items, but it is hard to see the context in which the task was planned. Now you can just click the icon ![]() and the task card will be displayed on the Kanban board.
and the task card will be displayed on the Kanban board.
Filter description
The last huge change is related to filters. An active filter has been indicated by the green border of the filter edit line since the first version of the ScrumDesk web edition. To see the filter details it was necessary to expand the filter to understand its details.
Now the details are displayed by more detailed text.

Minor
- Added command for a refresh of Timesheet report that keeps parameters set to the report.
- Description of charts added to every chart as a small question mark icon.
- Related items are ordered by their type.
- The due date filter is applied to subtasks as well.
- Charts are split into three sections – Team, Scrum Mastership, and product ownership charts.
- The period of an invoice is shown on the Billing page.
- Search looked for whole words and not substrings.
- The notification bubble for new comments was not positioned correctly.
- OKR node’s progress bar was not sized properly.
- Click on values displayed in selected charts displays product backlog item’s details.

