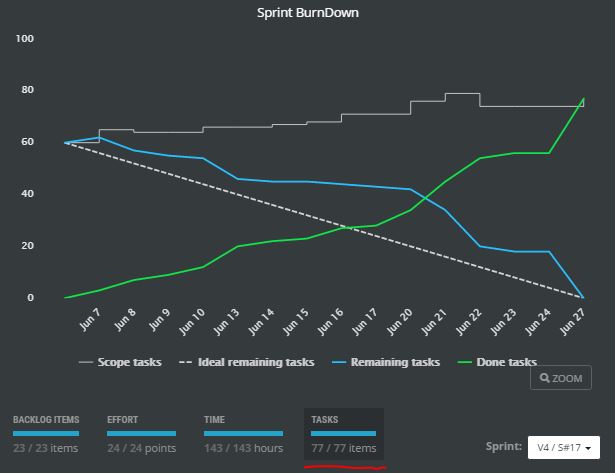
Tasks in burn down chart
Experienced agile teams don’t estimate tasks and therefore they need just to track how tasks are solved. If this is your situation, choose TASKS in burn down chart legend and there you are.
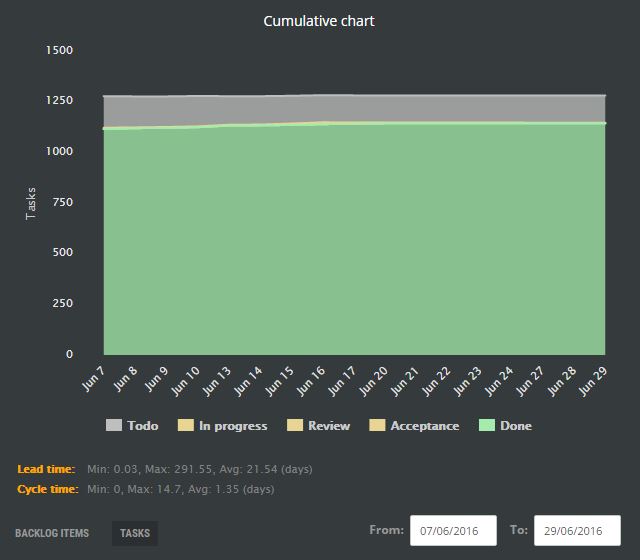
Cumulative Flow Chart for tasks
Cumulative flow chart displayed backlog items so far. Tasks are however important in case you need to identify bottlenecks in your process which can be customized with the possibility to add columns. Click TASKS in chart legend and you should see tasks in particular status for given day.
Business value chart
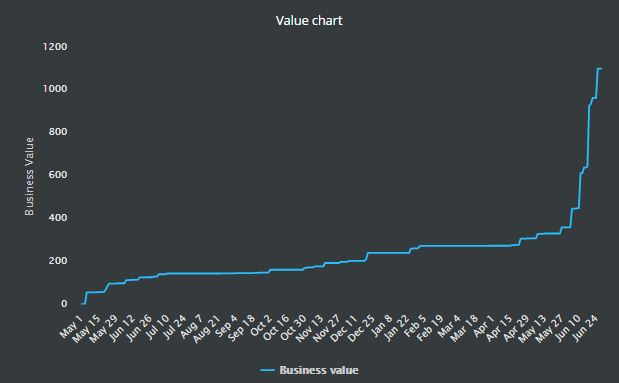
Do you add business value in every deploy, or just deliver another feature? The agile team should deliver working product that brings business value often and regularly. Business value chart shows how value has been added.
The flat line typically indicates that team is working on some defect fixes which do not add any value. The right product will have this line constantly growing.
Complexity Chart
And now, the question we here all the time. During the release, planning team provides an estimation in story points. Later, during the sprint planning, tasks are created and estimated in hours. Sometimes sprint estimation can be different comparing to estimation done in release planning. Maybe reality has changed. Maybe there is new information which makes story more complex. Or maybe, you just do not know to estimate and you are not consistent. Complexity chart displays the distribution of spent time for every completed story.
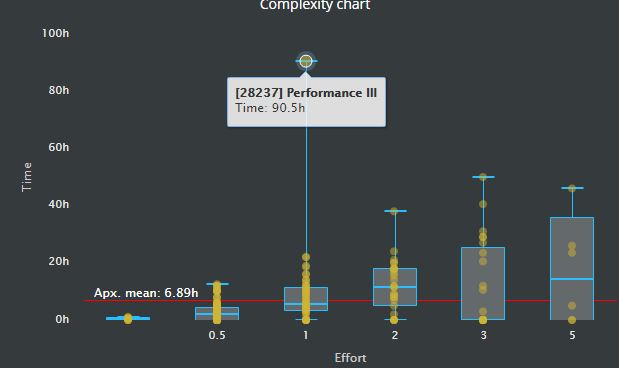
Stories are displayed as yellow circles. Chart displays minimum, mean and maximum spent time for a particular story point. You will find information about upper and lower quartiles as well.
Waiting flag
Aren’t you able to continue with the task, or backlog item because you are waiting for someone? Click task and toggle the red flag in the side view (or in the local menu) to indicate that to your team.
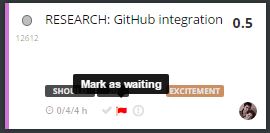
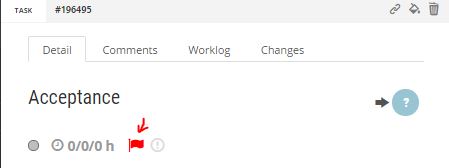
Assign to me
It is not necessary anymore to expand team members list and scroll to find your account. Click an arrow to assign task directly to the logged user. Quick & easy.

Backlog item lead & cycle time
ScrumDesk calculates lead and cycle time for every backlog item now. The team can see how long it took to finish the story (cycle time) since it has been added to the backlog (lead time). Click backlog item and see these data in the side view.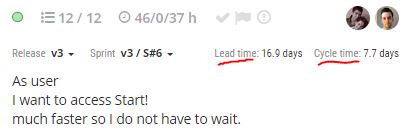
Split into release, or backlog
The uncompleted story can be split not just to the next sprints, but to release, or even to the product backlog. Product owners are fully empowered to own their backlog now.
Activate/Deactivate user
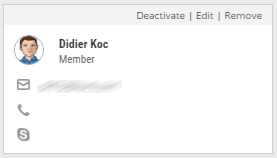
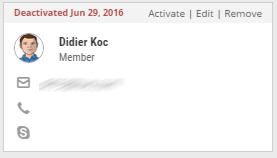
Account administrators can deactivate team members who will not be able to access projects temporary. This feature is usable for organizations working with freelancers, or vendors.
Minor
- Side view section Channel has been replaced by sections Comments, Work logs, Changes.
- Backlog items grouped by MoSCoW are sorted logically (Must, then should, then could).
- Message for destroyed items in Slack contains its name.
- Less spamming. Email notifications sent as bulk emails aggregating more changes in one email.
- Links to backlog items and subtasks in Slack.
- Improved multiselect of cards.
- Activities are applied and not fully stopped for items with appropriate permissions in multiselect.
