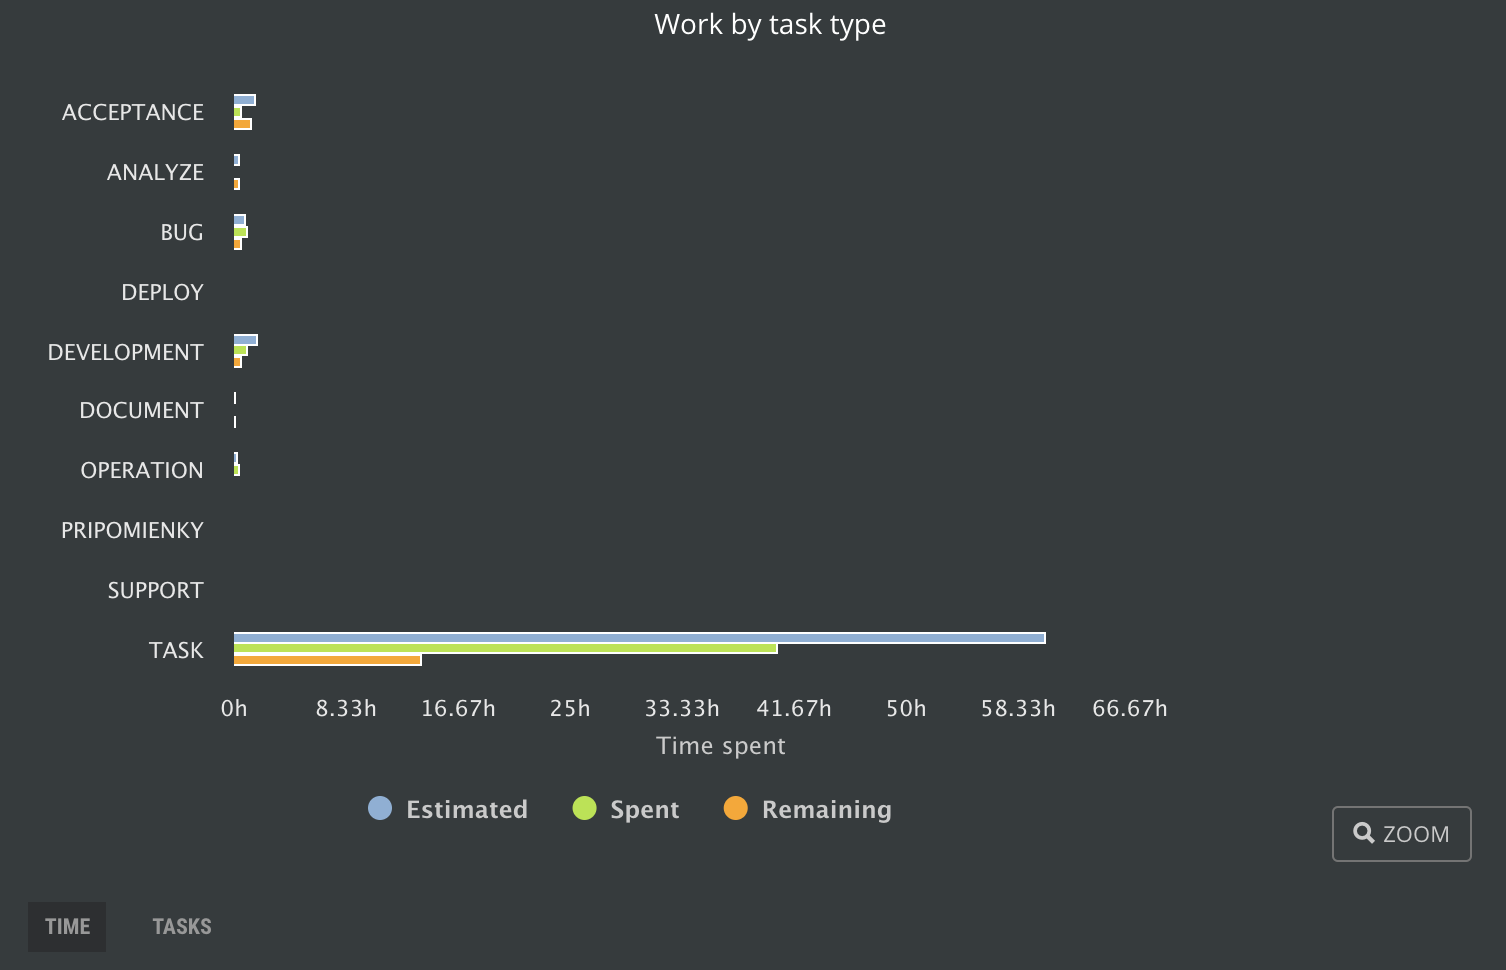
Chart Work by Task Type
Economics plays a role. Even in Agile. It is always good to understand what kind of effort the product owner needs to invest in. As backlog items can be split into subtasks of multiple types, calculation of that is much easier. The only prerequisite is necessary. To start to use task types consistently.
The chart Work by Task type displays an overview of how the work activities are distributed in your project to understand:
- Which activities are done very often and maybe they need to be optimized to increase the throughput.
- Which activities usually are forgotten hence the consistency is probably not good enough.
- An overview of the status of tasks of different task types.
This chart can be found on the Reports page and Scrum Mastership section.

Work by task type from a time perspective
To get a better overview of data, click chart serie name to show or hide data on the chart.
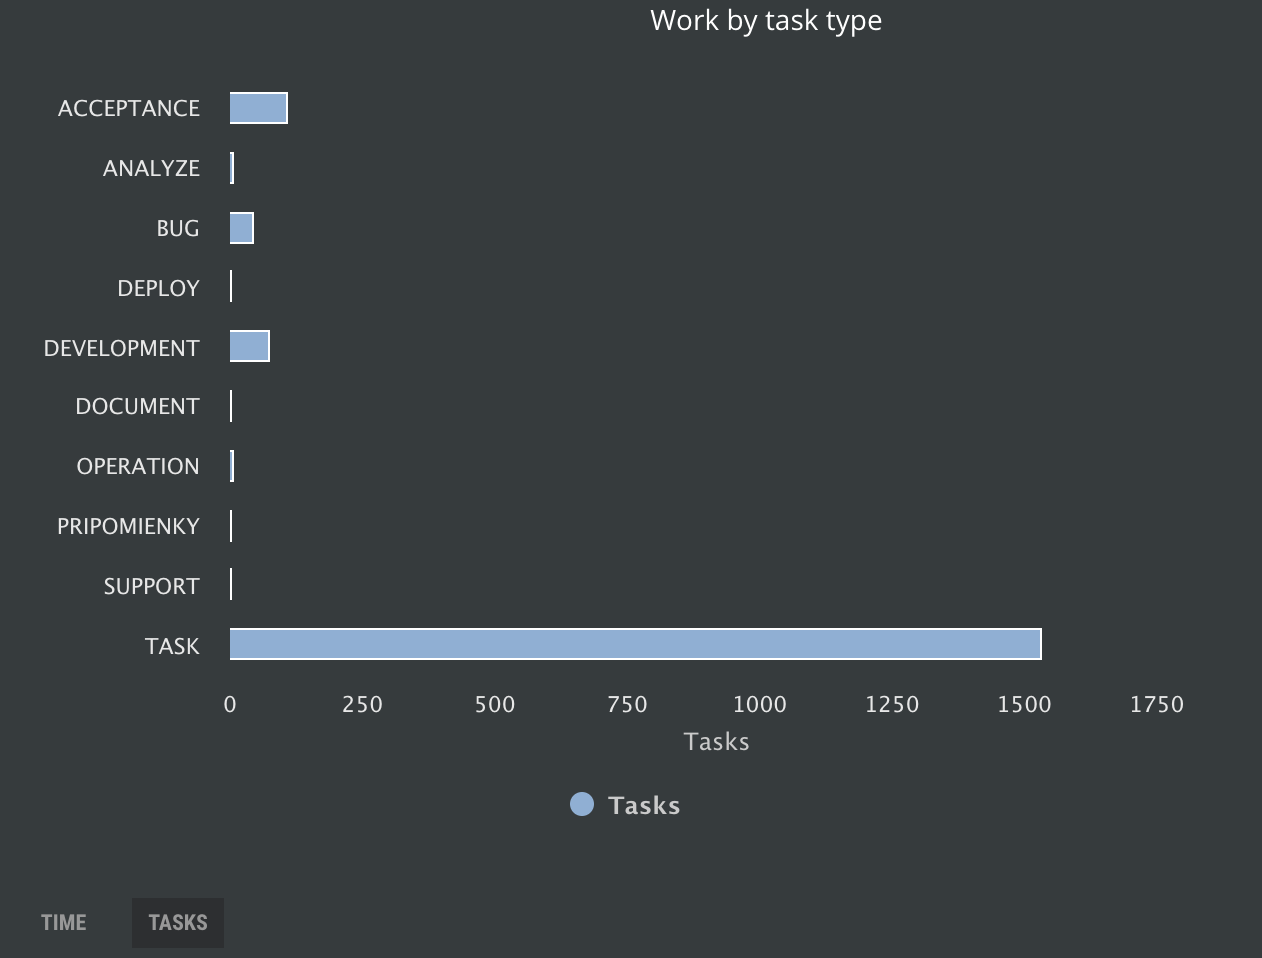
If your team doesn’t like an estimation, just the count of cards might be helpful too. Btw. not very if most of your tasks are the type of task :( as on the picture below. But you have the idea. Limit the maximum size for the task and start counting. With #noestimation principle.

Work by task type by a number of tasks
